Cost efficiency in plush toy production is usually approached from one direction: negotiating the price down after the design is finalized. Buyers submit a completed design, receive a quotation, and then attempt to reduce the number through negotiation, volume commitments, or supplier comparison.
This approach leaves the most significant cost reduction opportunity on the table — because the majority of a plush toy’s production cost is determined not by the margin negotiated between buyer and factory, but by the design decisions made before the quotation is even requested. A design that is optimized for cost efficiency will cost less to produce than one that is not, regardless of how well the unit price is negotiated. A design that is not optimized can cost 30, 50, or even 100 percent more than an equivalent product that achieves the same visual and quality outcome through more production-efficient choices.
This is not a guide about compromising on quality to reduce cost. It is a guide about making design decisions that achieve the intended quality and visual outcome through the most cost-efficient production approach — rather than the most obvious one. The best cost optimization does not reduce what customers receive. It reduces what the production process requires to deliver it.
Why Design Optimization Is the Most Underused Cost Lever in Plush Toy Sourcing?

Design optimization is the most underused cost lever in plush toy sourcing because it operates at a stage — the design phase — that most buyers treat as separate from cost considerations. Design is conceived as a creative exercise, focused on visual appeal and market positioning. Cost is addressed later, in the sourcing phase. By the time cost becomes the active conversation, the design is already fixed — and the design decisions that will determine the majority of the production cost have already been made without cost consideration.
Design optimization is the most powerful cost lever available to plush toy buyers because material costs represent 40 to 60 percent of production cost, and labor costs represent 25 to 35 percent — and both are directly determined by design choices made before a single sample is built. Panel count determines labor hours. Fabric specification determines material cost. Filling density determines material volume. Embroidery complexity determines machine time and skilled labor. Accessory choices determine component cost and assembly time. Every one of these cost drivers is a design variable — adjustable during design development at zero additional cost.
Here is a comparison of the cost levers available at different stages of product development:
| Cost Lever | Stage Available | Potential Cost Impact | Ease of Implementation | Risk to Product Quality |
|---|---|---|---|---|
| Design optimization | Design phase | 20–50% | Moderate — requires design iteration | Low if done correctly |
| Material specification optimization | Design and brief phase | 10–30% | Low — specification change only | Low to medium |
| Volume increase | Order phase | 10–25% | Medium — requires demand confidence | None |
| Supplier negotiation | Sourcing phase | 5–15% | Medium — requires leverage | None |
| Packaging simplification | Brief phase | 5–15% | Low | None |
| Payment term optimization | Contract phase | 2–5% | Low | None |
The Compounding Effect of Design Decisions
Design cost decisions do not operate independently — they compound. A design with a high panel count requires more cutting time, more sewing operations, more material waste from cutting, and more quality monitoring per unit. A design that also uses premium fabric in every panel, detailed multi-color embroidery, multiple custom accessories, and retail packaging adds cost at every layer simultaneously. Each individual design decision seems reasonable in isolation. The compounded result may be a product that costs twice what a thoughtfully optimized equivalent would.
The most effective cost optimization approach addresses all design cost drivers simultaneously — treating the design as a system where cost efficiency is one of the design objectives alongside visual appeal and quality standard — rather than addressing them one at a time after costs have already been established.
How Does Panel Count and Shape Complexity Drive Production Cost?
Panel count is the most direct determinant of labor cost in plush toy production. Every additional panel in a design requires additional cutting operations, additional sewing operations, additional panel handling time, and additional quality inspection steps. The relationship between panel count and production cost is not linear — it is slightly progressive, because higher panel counts also require more skilled operators for accurate assembly and more supervisor oversight to maintain alignment quality.
Panel count and shape complexity drive production cost through their direct impact on cutting time per unit, sewing operations per unit, skilled labor requirements, and production throughput rate. A simple design with six fabric panels can be produced at significantly higher throughput than a complex design with sixteen panels — which means fewer operator hours per unit at the six-panel design and correspondingly lower labor cost.
Here is a practical cost comparison across panel count ranges:
| Panel Count Range | Relative Labor Cost | Throughput Impact | Skill Requirement | QC Overhead |
|---|---|---|---|---|
| 4–6 panels | Baseline | Maximum throughput | Standard operators | Minimal |
| 7–10 panels | +15–25% | 10–15% throughput reduction | Medium skill | Low-moderate |
| 11–16 panels | +30–50% | 20–30% throughput reduction | High skill | Moderate |
| 17+ panels | +50–80% | 30–50% throughput reduction | Specialist operators | High |
Where Panel Reduction Creates Cost Savings Without Visual Compromise
The most effective panel reduction opportunities are in areas of the design that are not directly visible to the customer in normal product display or use. Internal construction panels, back panels that face away from display, and structural panels that create form without contributing to surface appearance can often be simplified without any visible change to the finished product.
For example, a plush toy head that is constructed from twelve panels to achieve a specific sculpted form can sometimes be reconstructed from eight panels using a different paneling strategy — one that achieves the same three-dimensional shape through different seam placement and panel sizing, while reducing the cutting and assembly operations required without changing the visible surface appearance.
This kind of panel reduction requires collaboration with an experienced pattern maker who understands both the construction requirements for the target shape and the range of paneling strategies available to achieve it. Buyers who bring cost optimization as a design objective to the pre-sampling conversation with their factory — rather than presenting the final design for execution and asking for cost reduction after the quote — are in a much better position to access this expertise.
Shape Complexity and Its Cost Implications
Beyond panel count, the complexity of individual panel shapes affects production cost through their impact on cutting precision requirements and material yield. Irregular, highly curved, or asymmetric panel shapes require more cutting precision than simple geometric panels — increasing cutting time and operator skill requirements — and produce more material waste because they tessellate less efficiently on the fabric roll, leaving more unused fabric between cut pieces.
Simplifying the geometric profile of individual panels — while maintaining the overall silhouette of the design — is a cost optimization opportunity that has no visual impact on the finished product while reducing cutting time and material waste. This simplification is most available in panels with complex internal curves or highly irregular outlines that serve no visual purpose — where a slightly simplified panel outline achieves the same construction result more efficiently.
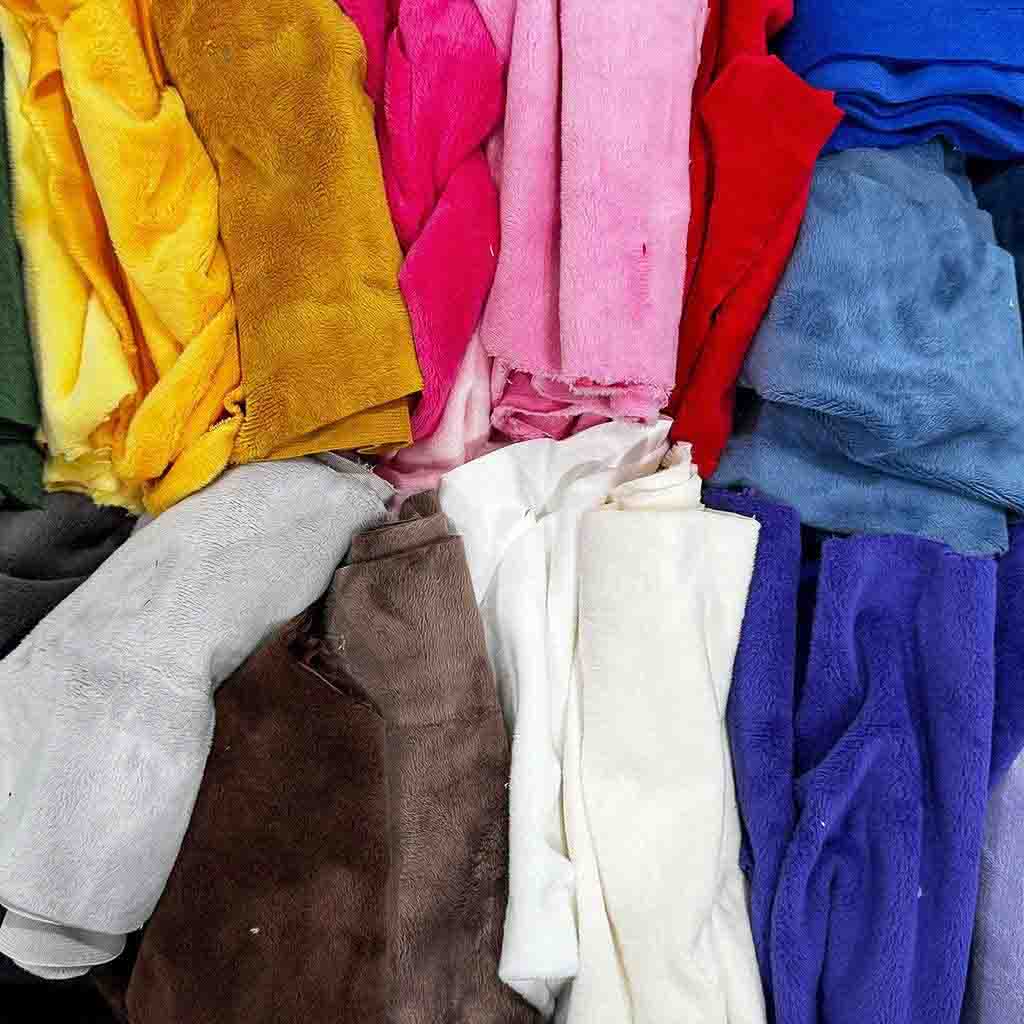
How Do Fabric Selection Decisions Create Cost Differences Without Sacrificing Quality?
Fabric is typically the largest single cost component in a plush toy — accounting for 25 to 40 percent of total production cost in most standard designs. Because fabric cost varies significantly between different pile heights, fabric constructions, and quality grades — sometimes by 50 to 100 percent for apparently similar fabrics — fabric selection decisions have a larger impact on total unit cost than any other single design variable.
Fabric selection decisions create cost differences without sacrificing quality through the strategic matching of fabric characteristics to the specific visual and functional requirements of each part of the design. Premium, high-cost fabric delivers the most value where customers directly perceive its quality — on the primary visible surfaces of the product. Using the same premium fabric on non-visible internal panels, structural areas, or surfaces that are rarely touched or inspected creates cost without corresponding quality benefit.
Here is a framework for matching fabric quality levels to design area requirements:
| Design Area | Customer Interaction | Fabric Quality Requirement | Optimization Opportunity |
|---|---|---|---|
| Primary face and front surface | Direct visual and tactile | Highest quality — full specification | None — this is the quality investment |
| Secondary visible surfaces | Regular visual | High quality | Minor simplification possible |
| Less visible surfaces | Occasional visual | Medium quality | Downgrade 1 quality tier |
| Internal construction panels | Not visible | Functional quality | Use standard fabric |
| Lining materials | Not visible | Functional | Use standard materials |
The Pile Height Optimization Opportunity
Pile height is one of the most significant fabric cost variables — longer pile fabrics cost more than shorter pile equivalents because they use more fiber in their construction. Within the range of pile heights that customers perceive as premium quality — typically 10 to 20mm depending on product category and market positioning — there is cost variation that does not translate directly into perceived quality difference at retail.
A design specified at 20mm pile can often achieve the same visual quality perception at 15mm pile at lower cost — because the quality cue customers use to perceive premium fabric is primarily softness and surface density rather than exact pile height. Working with a manufacturer to test different pile heights during sampling and identify the threshold below which the reduction becomes perceptually significant allows buyers to optimize pile height specification without crossing into quality perception loss.
Multi-Fabric Strategies for Targeted Quality Investment
One of the most effective fabric cost optimization strategies is the deliberate use of different fabric qualities in different areas of the same design — a multi-fabric strategy that concentrates premium fabric investment in the areas where customers perceive and value it most, while using more cost-efficient alternatives in areas where the quality differential is imperceptible.
For example, a character plush with a prominent face panel could use premium minky fabric on the face and a slightly less premium high-density plush on the body panels — achieving the face quality that customers focus on without paying the premium fabric price across the entire product. This approach requires careful design thinking about which surfaces customers interact with most and which fabric characteristics are most important at each area — and careful pattern and material management to ensure that the fabric transition is not visible at seam boundaries.
How Do Filling Choices and Stuffing Density Specifications Affect Unit Economics?
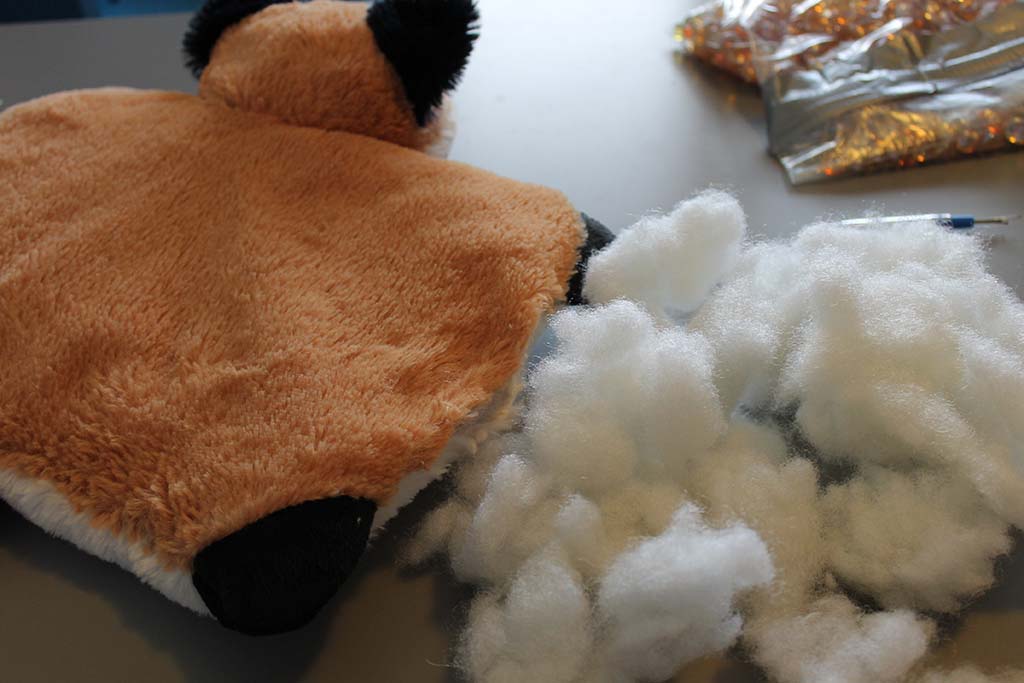
Filling materials — primarily PP cotton but also glass beads, alternative fillings, and their combinations — represent a meaningful portion of plush toy production cost, particularly for larger products where filling volume is significant. The filling cost is directly proportional to the specified density — a product specified at higher density requires more filling per unit, adding to both material cost and stuffing time.
Filling choices and stuffing density specifications affect unit economics through three mechanisms: the cost per kilogram of the filling material itself, the quantity of filling required per unit at the specified density, and the stuffing labor time required to achieve the specified density and distribution. All three are adjustable through design and specification decisions made before production begins.
Here is a comparison of filling cost variables and their unit economics implications:
| Filling Variable | Cost Driver | Unit Cost Impact | Optimization Approach |
|---|---|---|---|
| Filling material type | Material cost per kg | Medium | Match filling grade to quality requirement |
| Stuffing density specification | Volume per unit | Medium-High | Specify minimum effective density |
| Complex shape stuffing | Labor time per unit | High for complex shapes | Simplify internal construction for stuffing access |
| Hand-stuffing requirement | Skilled labor per unit | High | Minimize hand-stuffed areas through design |
| Filling distribution complexity | Labor time for distribution | Medium | Simplify areas requiring manual distribution |
Density Specification Optimization
Stuffing density is typically specified in a tech pack as either a target weight for the complete stuffed unit or a compression resistance standard measured by compressing the product to a defined height and measuring the resistance force. Both specifications determine the filling quantity per unit — and both can be optimized to find the minimum density that achieves the intended product feel and shape retention without exceeding it.
Over-specification of stuffing density — specifying a density that is meaningfully higher than the minimum required for the intended shape retention and feel — adds material cost without corresponding quality benefit. The optimization approach is to test different density levels during sampling — from minimum acceptable through the current specification — and identify the threshold below which the reduction produces a perceptible quality compromise. Any density specification above this threshold is an opportunity for cost reduction without quality impact.
When Premium Filling Grades Are and Are Not Justified
Premium PP cotton grades — higher loft, more consistent fiber length, better compression recovery — cost more than standard grades and are genuinely worth the premium for products where long-term shape retention under customer handling is a key quality attribute. For products that are primarily decorative and not subject to frequent compression, the premium for higher-loft cotton may not be recoverable in customer-perceived quality.
The appropriate filling grade specification depends on the product’s intended use and market positioning. Products positioned as premium, tactile, and repeatedly used benefit from premium filling grades whose quality advantage is perceptible. Products positioned as promotional, gift, or decorative items — where use is more occasional and shape recovery less critical — can achieve the required quality standard with standard filling grades at lower cost.
How Does Embroidery and Feature Design Impact Production Cost at Scale?
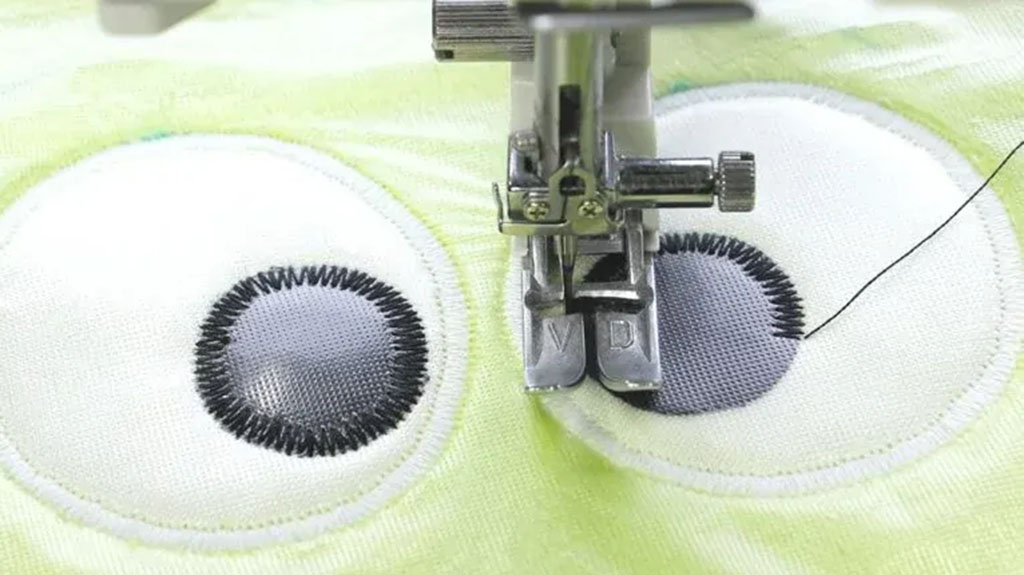
Embroidery is one of the most significant per-unit cost variables in plush toy production — not only because embroidery machine time has a direct per-minute cost, but because the machine programming, setup time, and quality monitoring requirements for embroidery add overhead costs that make complex embroidery designs disproportionately expensive relative to their apparent visual complexity.
Embroidery and feature design impact production cost at scale through four variables: the stitch count in the embroidery design (which directly determines machine time per unit), the number of thread color changes required (which adds setup time per unit), the number of separate embroidery placements per product (each requiring a separate hoop-and-position operation), and the precision requirements of the embroidery positioning (which determine QC monitoring intensity and acceptable throughput rate).
Here is a cost framework for embroidery design decisions:
| Embroidery Design Variable | Cost Driver Mechanism | Scale of Cost Impact | Optimization Approach |
|---|---|---|---|
| Total stitch count | Machine time per unit | High | Reduce stitch density in less-visible areas |
| Number of thread colors | Thread change setup time | Medium | Consolidate to minimum color count |
| Number of placement positions | Hooping operations per unit | High | Consolidate features where possible |
| Embroidery area size | Proportional to stitch count | High | Calibrate area to minimum effective size |
| Thread path complexity | Machine path distance | Medium | Simplify paths in non-critical areas |
Stitch Count Optimization Without Visual Impact
The most direct embroidery cost optimization is stitch count reduction — reducing the number of stitches in the design without reducing the visual impact of the embroidery. Stitch count can be reduced in several ways that have minimal or no visual impact: reducing the stitch density in fill areas that are not the focal point of the embroidery, replacing dense fill areas with outline-only approaches where the plush fabric texture provides sufficient visual presence, and simplifying the stitch path in transitional areas that connect primary embroidery elements.
The most common opportunity for stitch count reduction without visual impact is in the background or fill areas of embroidery designs — areas that are specified at high stitch density for manufacturing completeness but where the visual contribution of the high density is not perceptible to the end customer. Reducing the stitch density in these areas while maintaining the high density in the focal elements — the eye details, the expressive line elements — achieves the same visual impact at meaningfully lower machine time cost.
Consolidating Embroidery Placements
Each separate embroidery placement — each time the product must be removed from the embroidery frame, repositioned, and re-framed for a new embroidery element — adds a setup operation to the production cost. Designs with multiple small embroidery elements in different positions on the product are more expensive to produce than designs where the same visual elements are consolidated into a single embroidery program applied in one placement.
Where design allows, consolidating all embroidery elements that are near each other on the product surface into a single embroidery program reduces the hooping operations per unit — a direct labor cost reduction with no visual impact on the finished product.
How Do Accessory Choices and Functional Elements Add Disproportionate Cost?
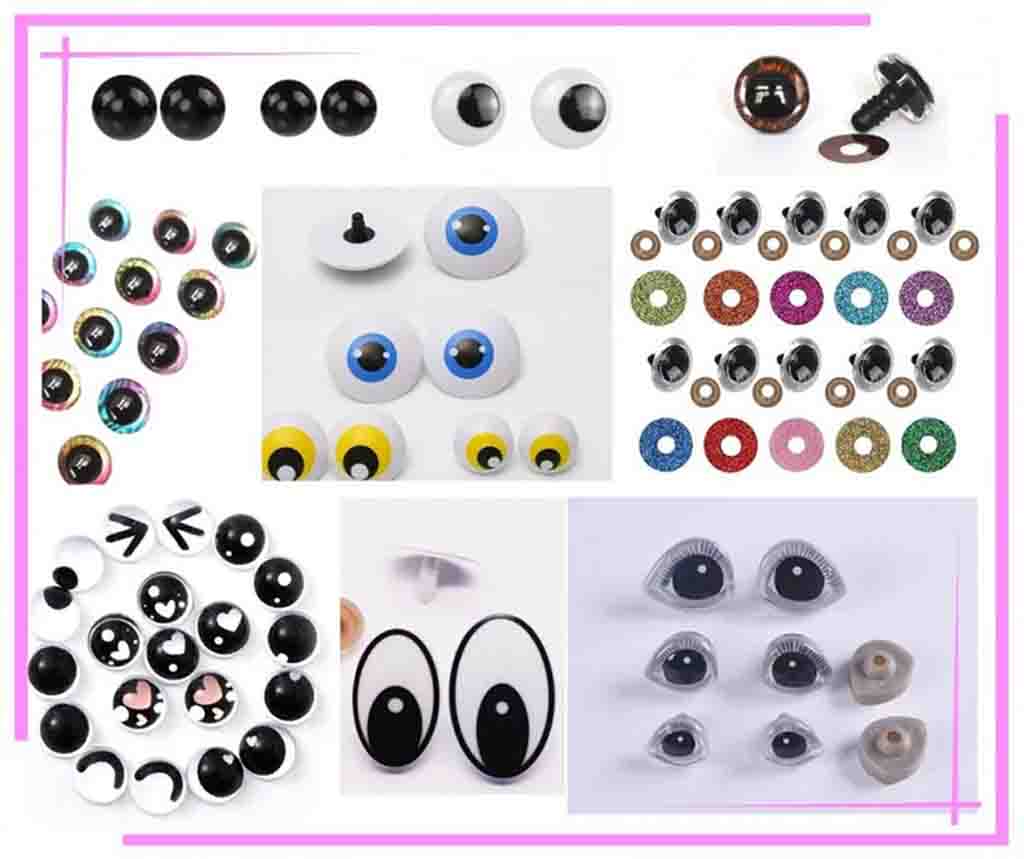
Accessories — safety eyes, noses, buttons, ribbons, sound modules, zippers, and other attached elements — add cost to a plush toy design through three separate mechanisms: the component cost of the accessory itself, the assembly labor required to attach it, and the quality monitoring overhead required to verify that safety-critical accessories are correctly attached. All three add to unit cost, and for some accessory types — particularly electronic components and functional elements — the additional cost is significantly larger than the component price alone suggests.
Accessory choices add disproportionate cost because the true cost of an accessory includes not just its purchase price but the assembly time required for correct installation, the pull force testing required for safety verification, and the production throughput reduction caused by the more complex assembly operations that accessories introduce.
Here is a framework for understanding the true cost of accessory decisions:
| Accessory Type | Component Cost | Assembly Time Impact | QC Impact | True Cost vs Apparent Cost |
|---|---|---|---|---|
| Standard safety eyes | Low | Low | Pull test required | 1.5–2× component cost |
| Large sculpted eyes | Medium | Medium | Pull test required | 2–2.5× component cost |
| Custom-molded nose | Medium-High | Medium | Pull test + position check | 2.5–3× component cost |
| Embroidered nose (alternative) | Minimal add | Included in embroidery | No additional | 1.1× embroidery cost |
| Ribbon/bow | Low | Medium | Attachment check | 2–3× component cost |
| Button/badge | Low-Medium | Medium | Pull test required | 2–2.5× component cost |
| Sound module | High | High | Functional test + battery check | 3–5× component cost |
| Zipper | Medium | High | Function test + strength check | 3–4× component cost |
| LED element | High | Very High | Safety + function test | 4–6× component cost |
The Embroidered Alternative to Physical Accessories
One of the most cost-effective substitution strategies in plush design optimization is replacing physical accessories with embroidered alternatives. A nose that is specified as a custom-molded plastic component — requiring tooling investment, component procurement, and pull force testing — can be replaced by a precisely embroidered nose that achieves the same visual result at a fraction of the total cost.
Similarly, decorative elements like brand badges, character marks, or decorative patterns that are specified as printed or woven accessories can often be replaced with embroidered equivalents that eliminate component procurement, separate attachment operations, and pull force testing while maintaining the same visual presence.
The embroidered alternative is not appropriate for all accessories — some elements require the three-dimensional presence or specific material quality of a physical accessory that embroidery cannot replicate. But for accessories whose primary function is visual identification or decoration rather than three-dimensional form, the embroidered alternative typically delivers equivalent visual results at significantly lower total cost.
When Custom Tooling Makes Sense — and When It Doesn’t
Custom tooling for accessory components — new molds for custom-shaped eyes, noses, or decorative elements — represents a fixed investment that adds to the per-unit cost at lower volumes but becomes negligible at high volumes. The decision to invest in custom tooling should be based on a break-even analysis: does the design differentiation and quality improvement from the custom component justify the tooling investment at the expected production volume?
For most product development projects at initial volumes — 500 to 2,000 units — the tooling investment for custom accessories rarely recovers its cost unless the custom element is a critical brand differentiator. Standard safety eye and accessory options from established suppliers offer significant variety — in size, color, and style — that can achieve the desired visual result without tooling investment. Working with an experienced factory to identify standard accessory options that meet the design requirement is typically more cost-effective than custom tooling at initial volumes.
How Does Packaging Design Affect the Total Cost of a Plush Product?
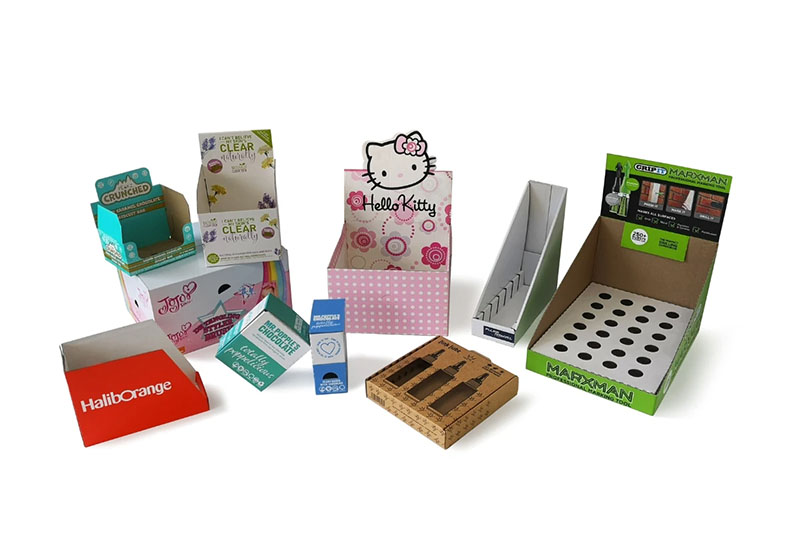
Packaging is a cost component that many buyers underestimate because it does not appear in the unit price of the product — it is often quoted and invoiced separately, or included in an all-in price without clear visibility. In reality, packaging can represent 8 to 20 percent of the total product cost depending on the complexity of the packaging design, the print quality, the structural complexity, and the quantity ordered.
Packaging design affects the total cost of a plush product through four variables: the structural complexity of the packaging (which determines printing, die-cutting, and assembly cost), the print quality specified (which determines printing process and material cost), the minimum order quantity requirements for the packaging (which affects per-unit cost at lower volumes), and the assembly labor required to insert the product into the packaging (which adds labor cost per unit to the packaging material cost).
Here is a comparison of packaging cost across different design approaches:
| Packaging Type | Relative Cost | MOQ Typical | Assembly Labor | Best Use Case |
|---|---|---|---|---|
| Plain polybag | Very Low | Flexible | None | Basic bulk or wholesale |
| Simple header card | Low | 500–1,000 | Minimal | Budget-conscious retail |
| Printed polybag | Low-Medium | 1,000–2,000 | None | E-commerce and wholesale |
| Window box — standard | Medium | 500–1,000 | Low | General retail |
| Custom printed window box | Medium-High | 1,000–2,000 | Low | Branded retail |
| Rigid gift box | High | 500–1,000 | Medium | Premium gift |
| Complex custom structure | Very High | 1,000–2,000 | High | Premium brand positioning |
Packaging MOQ and Its Unit Cost Impact
Printed packaging — window boxes, header cards, custom-printed polybags — typically carries minimum order quantities from the packaging supplier that may be higher than the buyer’s product order quantity. A buyer ordering 500 plush units may be required to order 1,000 custom-printed boxes — paying for packaging that will not be used for many months, or writing off the excess.
This packaging MOQ dynamic is one of the most commonly overlooked costs in new product launches — where the packaging investment can significantly exceed the expected level when the packaging MOQ is several times the initial product order quantity. Managing this risk requires either accepting the packaging MOQ and storing excess packaging, choosing packaging options with more flexible MOQs (such as standard packaging with printed inserts rather than fully custom boxes), or increasing the initial product order quantity to align with the packaging MOQ.
The Dieline Complexity and Print Specification Trade-off
Within custom-printed packaging, significant cost variation exists based on dieline complexity and print specification. A simple box structure with a single-color print on standard folding carton board is significantly less expensive than a complex die-cut structure with four-color process printing on premium board with spot UV varnish. Both can achieve effective retail presentation — but at very different cost levels.
For most plush toy market segments, the most cost-effective packaging approach invests print quality — color, imagery, and typography — in the customer-facing panels of the packaging while using simpler specifications for internal structure, back panels, and base. This approach concentrates visual investment where it creates customer-perceived value while minimizing cost in areas where specification differences are not customer-perceptible.
How Should Buyers Work with Their Manufacturer to Optimize Design for Cost Without Compromising Brand Standards?
Design optimization for cost efficiency is most effective as a collaborative process between buyer and manufacturer — because the manufacturer has manufacturing knowledge that makes specific cost optimization opportunities visible, while the buyer has brand knowledge that defines which quality and visual attributes are non-negotiable. The combination of these two knowledge sets produces better cost outcomes than either party could achieve independently.
Buyers should work with their manufacturer to optimize design for cost through a structured design review process conducted before sampling begins — a pre-sampling conversation where the manufacturer reviews the design brief and identifies specific cost optimization opportunities, the buyer assesses each opportunity against their brand standards, and the brief is revised to incorporate agreed optimizations before the first sample is built.
Here is a framework for the collaborative cost optimization process:
| Optimization Process Step | What Occurs | Who Leads | Outcome |
|---|---|---|---|
| Design brief submission | Buyer submits complete design brief | Buyer | Factory has full design information |
| Manufacturer cost review | Factory reviews brief and identifies cost drivers | Manufacturer | List of specific optimization opportunities |
| Opportunity assessment | Buyer evaluates each opportunity against brand standards | Buyer | Approved and rejected optimization opportunities |
| Brief revision | Brief updated to incorporate approved optimizations | Buyer with factory input | Cost-optimized brief ready for sampling |
| Sampling with optimized brief | First sample built to revised brief | Factory | Physical product demonstrating optimization effect |
| Optimization verification | Buyer evaluates whether optimization achieves intended result | Buyer | Confirmation or refinement of optimization |
| Final brief approval | Optimized brief confirmed for production | Both parties | Production reference established |
What to Ask Your Manufacturer During the Cost Review
The quality of the cost optimization opportunities identified in the pre-sampling review depends on the specificity of the questions the buyer asks and the manufacturer’s willingness to provide honest, technically informed answers rather than simply accepting the brief as presented.
Effective cost review questions include asking the factory to identify the three highest-cost elements in the design and whether there are alternative approaches that achieve similar visual results at lower cost. Asking specifically about panel count — whether any panels can be eliminated or combined without affecting the surface appearance. Asking about fabric choices — whether any panels use premium fabric where a less expensive alternative would be imperceptible. Asking about embroidery — whether the stitch count can be reduced in any areas without visible impact. And asking about accessories — whether any physical accessories could be replaced by embroidered alternatives.
A manufacturer who engages with these questions specifically and provides technically informed answers is demonstrating the development partnership depth that produces genuine cost optimization outcomes. A manufacturer who simply says “the design is fine as presented” without providing specific optimization input is not adding the manufacturing knowledge perspective that makes collaborative cost review valuable.
Protecting Brand Standards During Optimization
Cost optimization should never compromise the quality and visual attributes that define the product’s market positioning and brand standards. The discipline of the optimization process is identifying where cost can be reduced without customer-perceptible quality impact — not where cost can be reduced by reducing the quality customers receive.
Buyers should enter the optimization conversation with a clear internal definition of which product attributes are non-negotiable — the quality dimensions that define the product’s brand standards and must not be compromised regardless of cost implications. These non-negotiable attributes form the boundary conditions within which optimization operates. Any optimization opportunity that would compromise a non-negotiable attribute should be rejected, regardless of its cost saving potential.
Within these boundary conditions, the optimization process can systematically identify cost savings that are entirely invisible to customers — simplifications in non-visible construction, substitutions in non-perceived areas, and design adjustments that reduce production complexity without affecting the quality attributes customers value.
At Kinwin, design cost review is a standard component of our pre-development consultation process. When we receive a new design brief, our development team identifies specific cost optimization opportunities — with specific explanations of the trade-offs involved — as part of the initial feasibility assessment. This gives our clients the manufacturing knowledge they need to make informed decisions about which optimizations to accept, which to reject, and which to explore further through targeted sampling.
Our goal is not to reduce cost by reducing quality. It is to help our clients achieve the quality outcomes they need at the lowest production cost that genuinely achieves them — which is a fundamentally different objective that requires manufacturing expertise, design knowledge, and brand understanding working together.
If you are developing a new plush product and want to understand what cost optimization opportunities exist in your specific design, we would be glad to conduct a cost review as part of our pre-development consultation.
Reach out to our team at [email protected] or visit kinwintoys.com to start that conversation.
Conclusion
Cost efficiency in plush toy design is not achieved by compromising on quality. It is achieved by understanding where production cost originates — in panel count, fabric specification, filling density, embroidery complexity, accessory choices, and packaging design — and making design decisions that achieve the intended quality outcome through the most production-efficient approach available.
The buyers who source most cost-efficiently are not those who negotiate the hardest after designs are fixed. They are the ones who treat design optimization as a systematic part of the product development process — bringing cost awareness into the design phase, collaborating with their manufacturing partner to identify specific optimization opportunities, and making informed decisions about which optimizations to accept based on their brand standards and customer-perceived quality priorities.
This approach consistently produces better cost outcomes than post-design negotiation — because it addresses the cost drivers at their source rather than attempting to reduce the unit price after those drivers have already been locked in. The savings available through design optimization are larger, more reliable, and more sustainable than those available through negotiation alone.
At Kinwin, we bring manufacturing expertise to this optimization process as a standard part of how we work with our clients — because we believe that the best manufacturing partner is one who helps you build better products at better costs, not just one who executes what you specify at the lowest price they can quote.
FAQ
Q1: How early in the product development process should cost optimization be considered, and is it too late once a design is already finalized?
Cost optimization is most effective when it is considered during the initial design phase — before the brief is submitted to the factory and before any sampling investment is made. At this stage, every design element is still adjustable, and optimization decisions can be made without revision cost or timeline impact. Once a design is finalized and sampling has begun, optimization is still possible but becomes progressively more constrained — revising a design after the first sample has been built requires additional sampling investment and extends the timeline. Even after bulk production has begun, some optimization opportunities exist — in packaging specification, labeling approach, or packing method — but the primary product cost drivers are already fixed. The practical recommendation is to build a cost review into the design process before brief submission as a standard step, rather than treating it as a remediation activity after costs have already been established.
Q2: How much cost reduction can realistically be achieved through design optimization on a typical plush toy product?
The range of cost reduction achievable through design optimization varies significantly based on how far from cost-efficient the original design is and which optimization opportunities are available without compromising brand standards. For designs that were developed primarily for visual impact without cost consideration — typical of first-time buyers or designers without manufacturing knowledge — design optimization routinely produces 20 to 35 percent unit cost reduction. For designs that were already created with some production efficiency awareness, the optimization opportunity is typically 10 to 20 percent. For designs that are already well-optimized, incremental improvements of 5 to 10 percent may be available through fine-tuning of specific elements. In all cases, the cost reduction comes from making production more efficient rather than from reducing the quality or visual impact the customer receives — which is what distinguishes cost optimization from cost cutting.
Q3: Does design optimization require significant redesign work, or can it often be achieved through small adjustments?
Most design optimization can be achieved through relatively small adjustments rather than fundamental redesign — which is one of the reasons it is underutilized. Reducing a panel count from fourteen to ten by adjusting seam placement on non-visible surfaces does not change the product’s appearance but meaningfully reduces production cost. Specifying a 15mm pile height instead of 20mm where the visual quality is equivalent achieves cost savings without design change. Replacing a custom-molded nose with an embroidered equivalent at the same visual quality produces cost savings without affecting the character’s expression. These adjustments require design judgment but not design rethinking — they operate within the established design direction rather than changing it. The investment required is typically a focused two to three hour review conversation between the buyer and the factory’s development team, followed by a targeted revision of specific brief elements. This is a very low investment relative to the cost savings it produces across the full production volume.
Q4: How should buyers evaluate whether a factory’s cost optimization suggestions are genuinely in their interest or primarily in the factory’s interest?
Some cost optimization suggestions that factories make are genuinely in the buyer’s interest — reducing panel count reduces both the factory’s production cost and the buyer’s unit cost proportionally. Others may be primarily in the factory’s interest — simplifying a product element that reduces the factory’s labor intensity but produces a quality reduction that the buyer will not discover until the product reaches customers. Evaluating the intent behind cost optimization suggestions requires asking specifically what the visual and quality impact of each proposed change will be — and requesting that the change be demonstrated in sampling before being confirmed for production rather than accepting it based on verbal description. Any cost optimization suggestion that cannot be clearly shown to have no customer-perceptible quality impact in a physical sample should be treated with caution. The appropriate process is: factory identifies opportunity, buyer assesses against brand standards, change is tested in sampling, buyer confirms acceptability of result in the physical sample, change is incorporated in the production brief. This process prevents cost optimization from being used as a vehicle for quality reduction that the buyer does not explicitly authorize.
Q5: Can design optimization be applied to reorders of existing products, or is it only relevant for new product development?
Design optimization can absolutely be applied to reorders of existing products — and for many buyers, reorder optimization is actually the most commercially significant application because the product has an established sales volume that makes cost savings across multiple order cycles compound significantly. Reorder optimization typically focuses on three areas. First, packaging optimization — reassessing the packaging specification based on actual market performance and customer feedback to identify whether any elements of the packaging can be simplified without commercial impact. Second, filling density adjustment — if the product has been selling at the current density specification without density-related complaints, assessing whether a slight density reduction within the acceptable range is possible. Third, material grade optimization — if the current fabric specification was set conservatively to ensure quality without market validation, assessing whether a marginally lower pile height or density achieves the same customer-perceived quality based on the positive reception the product has received. All of these optimizations should be tested in sampling rather than implemented directly in production — to confirm that the optimization achieves the intended result before committing the full reorder volume to the adjusted specification.