Cost control in plush toy manufacturing is frequently misunderstood as a choice between saving money and maintaining quality — as if the two exist on a scale where moving toward one necessarily means moving away from the other.
This framing is wrong — and acting on it is one of the most consistent sources of sourcing failure in the plush toy category. Buyers who try to control costs by accepting lower-quality materials, reducing quality control investment, or pressuring suppliers to cut corners on production processes do not achieve sustainable cost reduction. They achieve short-term price savings that are offset by higher defect rates, compliance failures, revision rounds, and the brand damage that comes from quality problems reaching customers.
Genuine cost control in plush manufacturing works in the opposite direction. It identifies where production cost is being generated and addresses it at the source — through smarter design decisions, more precise material specifications, more strategic order volume planning, and more effective production processes — rather than through quality compromises that move the problem downstream where it is more expensive to manage.
This guide explains where plush toy costs are genuinely controllable, how to reduce them without reducing quality, and how to build a cost-quality optimization discipline into every product development and production cycle.
Why Cost Control and Quality Are Not Opposing Forces in Plush Manufacturing?

The belief that cost and quality are inherently in tension reflects a specific kind of cost reduction — the kind that works by reducing what the customer receives. This approach does reduce cost. It also reduces quality proportionally — and those quality reductions produce their own costs through returns, complaints, compliance failures, and brand erosion that are systematically larger than the savings achieved.
There is a second kind of cost reduction — the kind that works by reducing what the production process requires to deliver the intended quality outcome. This approach reduces cost without reducing what customers receive, because it targets production inefficiency rather than product quality. Design changes that achieve the same visual result with fewer fabric panels. Material specifications that precisely match quality requirements rather than exceeding them unnecessarily. Order volumes that reach favorable unit economics without excessive inventory risk. Quality systems that prevent defects at low cost rather than catching them at high cost.
This second approach is what genuine cost control looks like in plush manufacturing — and it requires a fundamentally different analytical framework from the first.
Here is a comparison of the two approaches and their outcomes:
| Cost Reduction Approach | Method | Short-Term Saving | Long-Term Outcome |
|---|---|---|---|
| Quality compromise approach | Accept lower-grade materials, reduce QC investment | 10–20% unit price reduction | Higher defect rates, compliance failures, brand damage |
| Production efficiency approach | Optimize design, specify materials precisely, improve processes | 15–35% cost reduction | Same quality, lower total project cost |
| Volume strategy approach | Align order quantities with demand forecasts | 10–25% unit price improvement | Better economics without quality impact |
| Supplier relationship approach | Build long-term relationships that unlock commercial terms | 5–15% cost improvement over time | Consistent quality, improving economics |
The Total Cost Framework
The most important analytical tool for cost control without quality compromise is total cost accounting — calculating the true cost of a production run across all cost dimensions rather than focusing exclusively on the unit price. When defect remediation costs, compliance failure costs, revision round costs, and brand damage costs are included in the total, decisions that look like cost savings based on unit price often reveal themselves as cost increases based on total investment.
Buyers who make cost decisions using total cost accounting consistently achieve better outcomes than those who optimize for unit price — because the quality management investments that appear to add cost in the unit price calculation typically reduce total cost by a multiple of their unit price impact.
How Does Design-Stage Optimization Offer the Largest Cost Savings?

Design-stage optimization is the most powerful cost lever available in plush toy manufacturing — and the most underutilized. It is more powerful than supplier negotiation, more powerful than volume strategy, and more powerful than any production process adjustment — because it operates on the cost drivers that determine the baseline production cost before any other variable is considered.
Design-stage optimization offers the largest cost savings because the majority of a plush toy’s production cost is determined by design choices made before sampling begins. Panel count determines labor time. Fabric type and area determine material cost. Accessory complexity determines component and assembly cost. Embroidery design determines machine time. Packaging specification determines packaging cost. All of these are design variables — adjustable at the design stage at essentially zero cost, but locked in once production begins.
Here is a quantified guide to cost savings available through design optimization by category:
| Design Cost Driver | Baseline Cost Contribution | Optimization Opportunity | Potential Saving | Quality Impact |
|---|---|---|---|---|
| Panel count reduction | 20–30% of labor cost | Reduce from 14 to 10 panels where seam placement allows | 10–20% labor reduction | None if correctly done |
| Fabric grade optimization | 25–40% of total cost | Match premium fabric to visible surfaces only | 10–25% material saving | None — visible quality preserved |
| Embroidery stitch count | 8–15% of production cost | Reduce stitch density in non-focal areas | 15–25% embroidery cost saving | None — focal areas unchanged |
| Accessory substitution | 5–12% of total cost | Replace custom-molded with standard equivalents | 20–40% accessory cost saving | Minimal — visual equivalent |
| Packaging simplification | 8–15% of total cost | Standard structure with brand-specific print | 15–30% packaging saving | None — brand presence maintained |
The Pre-Sampling Design Review
The design review stage — where the manufacturer evaluates the design brief before sampling begins and identifies specific optimization opportunities — is the mechanism that makes design-stage cost optimization practical for buyers who do not have deep manufacturing knowledge. An experienced manufacturer can look at a design brief and identify in 30 minutes the panel reduction opportunities, material simplification possibilities, and construction alternatives that would take a buyer without production expertise weeks to develop independently.
This review must happen before sampling begins — not after the first sample arrives. Once a sample is approved, the design is effectively locked for that production cycle. Changes proposed after sample approval require new sampling investment and extend the timeline — making post-approval optimization significantly more expensive than pre-sampling optimization.
The practical implication is that buyers who present designs to their manufacturer as finalized briefs and ask for execution are leaving the most significant cost optimization opportunity unused. Buyers who present designs as starting points for a collaborative cost review — asking specifically “what would you change to reduce cost without reducing the quality our customers will experience?” — consistently achieve better cost outcomes without quality compromise.
How Do Material Decisions Create Cost Efficiency Without Compromising the Customer Experience?
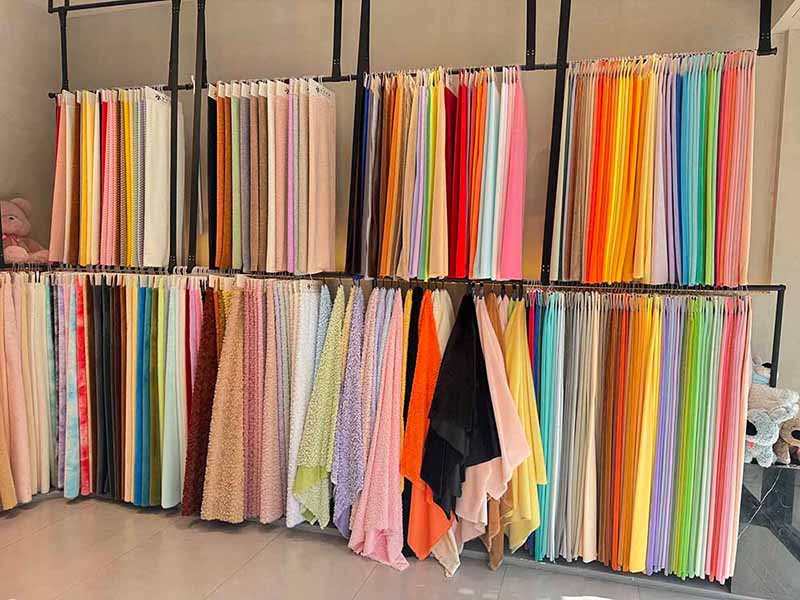
Material decisions are the second most powerful cost lever in plush manufacturing — representing 40 to 60 percent of total production cost and offering significant optimization opportunity through precise specification of material grades to the requirements of each product area and intended use.
Material decisions create cost efficiency without compromising customer experience through a specific principle: the cost of a material should match the quality perception it creates for the customer in the specific context where it is used. Premium materials create disproportionate cost when used in areas where their quality advantage is not perceptible. Standard materials create quality perception gaps when used in areas where the quality difference matters.
Here is a framework for material grade decisions aligned with customer perception:
| Product Area | Customer Interaction | Fabric Grade Requirement | Optimization Opportunity |
|---|---|---|---|
| Face and frontal surfaces | Direct visual and tactile — primary quality signal | Highest appropriate grade for positioning | None — this is the quality investment |
| Primary body surfaces — regularly touched | Tactile — secondary quality signal | High quality | Minor downgrade possible if imperceptible |
| Secondary visible surfaces — occasionally touched | Visual — tertiary quality signal | Medium-high quality | One grade reduction possible |
| Back and underside surfaces | Rarely seen or touched | Functional quality | Significant reduction possible |
| Internal lining and structural panels | Not visible or touchable | Functional only | Use cost-efficient standard material |
The Pile Height Optimization Opportunity
Pile height is one of the most significant cost variables within any given fabric quality level — longer pile uses more fiber and costs more per square meter. Within the ranges that customers perceive as premium quality, there is often meaningful cost variation that does not create a corresponding quality perception difference.
A fabric specified at 20mm pile can frequently achieve the same quality perception at 15mm — because the customer’s perception of softness and premium feel is primarily determined by pile density and fiber quality rather than pile length above a certain threshold. Testing this transition during sampling — comparing 20mm and 15mm pile versions of the product side by side in a blind evaluation — provides direct evidence of whether the pile height reduction is perceptible before committing to the lower specification.
For products where pile height has been specified based on convention rather than specific customer research, this sampling comparison often reveals that a one to three millimeter reduction is commercially invisible while producing meaningful material cost savings across the full production volume.
Compliance-Certified Materials — Cost and Risk Balance
One material cost decision that must be made carefully is the compliance certification status of materials. Certified materials — OEKO-TEX, REACH-compliant, CPSIA-compatible — cost more than uncertified alternatives. Buyers who select uncertified materials to reduce cost accept the compliance failure risk that uncertified materials carry — and compliance failure costs of $5,000 to $25,000 are many times larger than the material cost saving that created the risk.
The cost-efficient decision is not to avoid certified materials — it is to specify them only at the quality level required for the product’s compliance obligations. For products sold in the US and EU, certified materials are a non-negotiable cost that should be planned for explicitly rather than treated as optional. For products sold in non-regulated markets, the certification requirement may be different and the material cost saving may be genuine rather than illusory.
How Does Order Volume Strategy Affect Unit Economics Without Sacrificing Standards?

Order volume is one of the most directly controllable cost variables available to buyers — and one of the most commonly mismanaged in ways that either waste cost efficiency potential or create inventory risks that offset the economic gains.
Order volume strategy affects unit economics through the fixed cost distribution mechanism: higher volumes distribute fixed production costs across more units, reducing per-unit cost. But volume strategy involves more than finding the highest justifiable MOQ — it involves aligning the order volume with demand confidence, inventory management capability, and reorder cycle planning in a way that optimizes economics across the full production and sales cycle rather than just at the point of order.
Here is a strategic framework for order volume decision-making:
| Volume Decision Scenario | Economic Logic | Risk Consideration | Recommended Approach |
|---|---|---|---|
| First product launch | Validate market before large inventory commitment | Demand uncertainty is high | Minimum viable quantity for market testing |
| Second order — proven concept | Unit economics improve significantly above launch MOQ | Demand partially validated | 50–100% increase over launch quantity |
| Established product — predictable demand | Maximum cost efficiency through higher volume | Inventory carrying cost | Order to 3–4 month inventory horizon |
| Seasonal product — defined window | Order to meet seasonal demand, not reorder cycle | Excess inventory risk is high | Conservative forecast with buffer |
| Range extension — new design | New demand uncertainty despite established brand | Same risk as first launch on new design | Market-test quantity per new design |
| Promotional product — event-driven | Defined demand volume | Leftover inventory has no value | Order to defined event requirement |
The Consolidation Strategy
One of the most effective volume strategies for buyers developing multiple designs simultaneously is consolidation — structuring the order so that multiple designs share a single production order rather than being ordered separately. Consolidation achieves several economic benefits: it allows the buyer to reach a higher total order value that unlocks better pricing tiers, it allows the factory to schedule production more efficiently across designs with shared construction approaches, and it reduces the per-order fixed costs — logistics, documentation, administrative overhead — by combining what would otherwise be multiple orders.
The constraint on consolidation is design readiness — all designs in a consolidated order must complete sampling before production can begin for any of them. Buyers who stagger sampling across designs and then wait until all are ready before ordering may delay production on designs that are ready, undermining the timeline efficiency that drives some of the consolidation’s appeal.
Managing this constraint requires deliberate sampling sequencing — prioritizing the designs that are furthest from sampling completion so that they catch up to the designs that complete sampling first, allowing the consolidated order to proceed without significant overall timeline extension.
How Do Production Process Choices Impact Cost Efficiency at Scale?
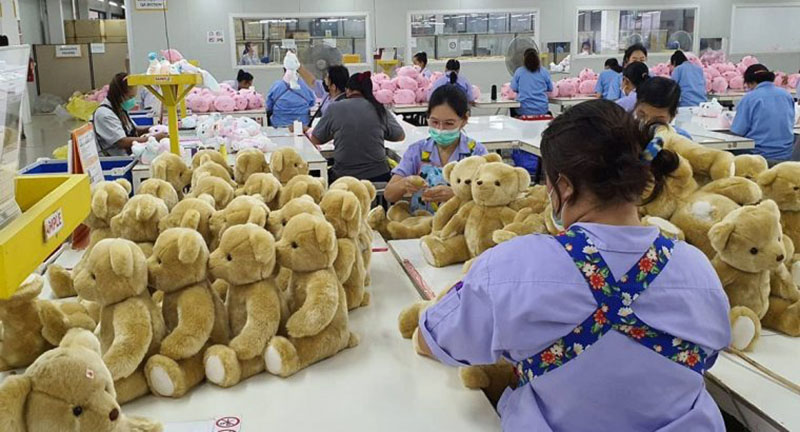
Production process choices — the specific construction methods, sewing sequences, stuffing approaches, and assembly techniques used to manufacture a plush toy — affect production cost through their impact on throughput rate, labor intensity, and error rate. Processes that are more efficient, require less skilled labor, or produce fewer defects create lower per-unit production cost at the same quality level.
Production process choices impact cost efficiency at scale because their effect on throughput and error rates compounds across every unit in the production run. A process that produces 10 percent more units per operator per hour generates 10 percent lower labor cost per unit across the entire run. A process that reduces the defect rate by 5 percentage points reduces the rework cost for those units across the entire run. At 5,000 units, these differences are commercially significant.
Here is a framework for understanding how production process choices affect cost efficiency:
| Process Choice | Cost Efficiency Mechanism | Quality Impact | Cost Impact at 5,000 Units |
|---|---|---|---|
| Simplified construction sequences | Higher throughput rate | None if design intent maintained | 8–15% labor cost reduction |
| Machine stuffing over hand stuffing | Consistent density at higher throughput | Positive — more consistent density | 10–20% stuffing labor reduction |
| Embroidery program optimization | Fewer hoop repositionings, shorter cycle time | None if design maintained | 15–20% embroidery cost reduction |
| Panel pre-marking for alignment | Reduced operator judgment requirement | Positive — more consistent alignment | 5–10% sewing labor reduction |
| Efficient thread management | Reduced thread waste and break frequency | Positive — fewer thread interruptions | 3–7% thread and labor cost reduction |
Construction Sequence Optimization
Construction sequence optimization — the process of reviewing the assembly order of a plush toy’s components and identifying sequences that reduce the total number of machine passes or handling steps required — is one of the most practically achievable production process cost improvements for complex designs.
A construction sequence that was designed for accuracy without considering throughput may require the operator to handle the partially assembled product seven times before it reaches the stuffing stage. An optimized sequence that achieves the same final assembly result with five handlings reduces operator time per unit by approximately 30 percent at that production stage — compounding across thousands of units into significant total labor cost reduction.
This sequence optimization is most effectively done collaboratively between the buyer and factory at the design and sampling stage — when the construction approach is still being developed and changes can be made without sampling cost. At production scale, changing construction sequences requires production line reorganization and potentially retraining that is significantly more disruptive than making the same changes before sampling has begun.
How Does Quality Control Investment Actually Reduce Total Cost?

Quality control investment appears on the cost sheet as an addition — QC personnel, testing equipment, inspection protocols, third-party inspection fees. From a unit price perspective, quality control adds cost. From a total cost perspective, quality control consistently reduces cost — because the problems it prevents are more expensive than the investment that prevents them.
Quality control investment reduces total cost through the defect prevention economics described throughout this guide: every defect caught by IQC before production is less expensive to address than the same defect caught in FQC; every defect caught in FQC is less expensive to address than the same defect discovered after shipment; every defect prevented by in-process monitoring is less expensive to address than the same defect discovered in final inspection.
Here is a concrete illustration of quality control investment economics:
| QC Investment | Annual Cost | Defects Prevented | Defect Remediation Cost Avoided | Net Economic Value |
|---|---|---|---|---|
| IQC program (personnel + equipment) | $15,000 | 3 compliance failures (avg $10K each) | $30,000 | +$15,000 |
| IPQC monitoring (personnel + time) | $20,000 | 5% defect rate reduction (from 8% to 3%) | $25,000 rework avoided | +$5,000 |
| Third-party inspection ($500 per order, 20 orders) | $10,000 | 2 batch rejection incidents (avg $15K each) | $30,000 | +$20,000 |
| Counter sample program | $8,000 | 4 sample-to-bulk incidents (avg $8K each) | $32,000 | +$24,000 |
| Total QC investment | $53,000 | $117,000 avoided | +$64,000 |
This calculation is illustrative — actual numbers vary by factory scale and defect history. But the directional economics are consistent: quality control investment generates positive returns when the defects it prevents are more expensive than the investment required to prevent them. In plush manufacturing, they consistently are.
Quality Control as a Competitive Advantage
Beyond its direct cost economics, quality control investment creates a competitive advantage that compounds over time — through the review scores, repeat purchase rates, and brand reputation that accrue to brands whose products consistently meet or exceed customer quality expectations.
Brands that invest in manufacturing quality consistently outperform those that compete on price at the expense of quality — because quality creates customer loyalty and word-of-mouth that reduces customer acquisition cost, while quality failures create churn and negative reviews that increase it. In e-commerce channels where review score is a primary driver of organic visibility, this quality advantage has a direct commercial value that can be measured in platform ranking and conversion rate.
How Do Packaging and Logistics Decisions Affect Total Product Cost?
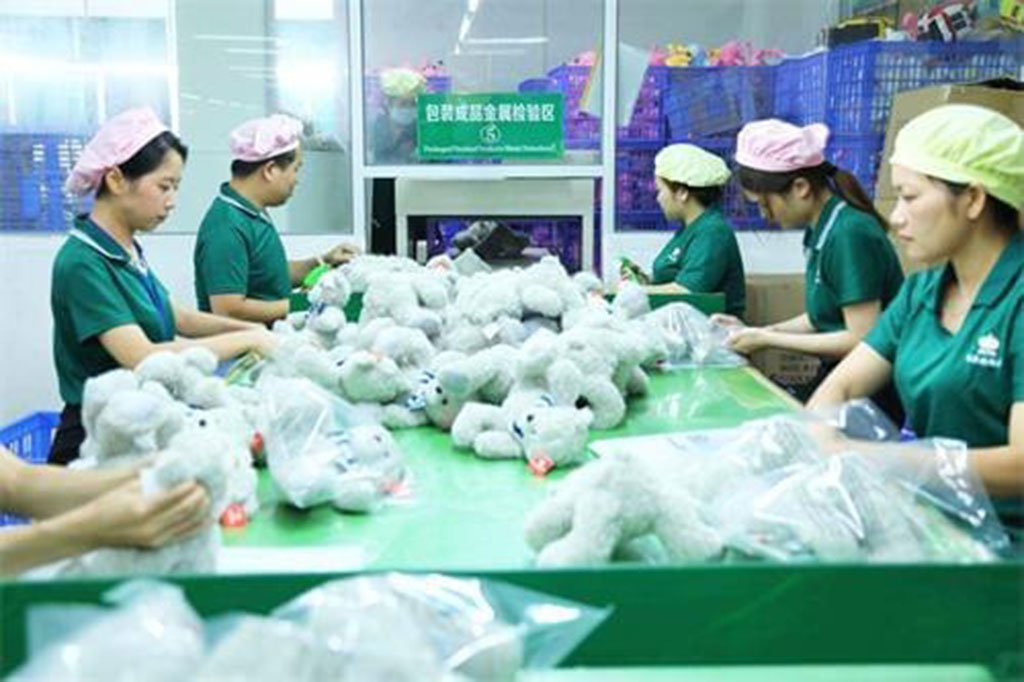
Packaging and logistics decisions represent 15 to 30 percent of a plush toy product’s total landed cost — a significant portion that is often under-optimized because it is addressed at the end of the development process rather than integrated into the cost planning from the beginning.
Packaging and logistics costs affect total product cost through four dimensions: packaging material and structure cost, packaging minimum order quantities that may create excess inventory, dimensional weight considerations that affect freight cost for bulky products, and the logistics inefficiency that comes from packaging designs that do not optimize for shipping density.
Here is a framework for packaging and logistics cost optimization:
| Cost Area | Cost Driver | Optimization Approach | Savings Potential |
|---|---|---|---|
| Packaging structure | Design complexity and material quality | Standard structure with custom print versus fully custom structure | 15–25% packaging cost |
| Packaging MOQ | Custom packaging minimum exceeds product quantity | Align packaging MOQ with production quantity | Eliminate excess inventory cost |
| Shipping dimension | Large packaging creates dimensional weight premium | Optimize packaging dimensions for product, consider vacuum compression | 15–40% freight cost on bulky products |
| Polybag specification | Over-specified polybag material | Match polybag specification to product requirements | 10–20% polybag cost |
| Carton configuration | Inefficient carton fill creates freight waste | Optimize inner carton configuration for density | 5–15% freight cost |
| Master carton dimensions | Carton dimensions not optimized for container loading | Design carton dimensions for efficient container fill | 3–8% container utilization |
The Dimensional Weight Factor
Plush toys are volume-heavy products — they occupy a large space relative to their actual weight. For air freight, freight carriers charge the higher of actual weight and dimensional weight — where dimensional weight is calculated as the package volume divided by a dimensional weight factor. For plush toys, this means that the actual freight cost is often determined by dimensional weight rather than actual weight, with oversize products paying a significant premium.
Optimizing packaging dimensions to minimize the volume-to-product-size ratio — through more form-fitting packaging, vacuum compression for soft products, or efficient inner carton configuration — directly reduces the dimensional weight, which directly reduces freight cost. For products shipped by air, this optimization can reduce freight cost per unit by 20 to 40 percent — a saving that is available without any quality impact and without any change to the product itself.
The packaging dimension optimization should be conducted before the packaging design is finalized — not after the packaging is already produced and the shipping window is being planned. At the design stage, dimensional changes cost nothing. At the shipping stage, they require new packaging — adding both cost and delay.
How Should Buyers Work with Their Manufacturer to Find the Right Cost-Quality Balance?
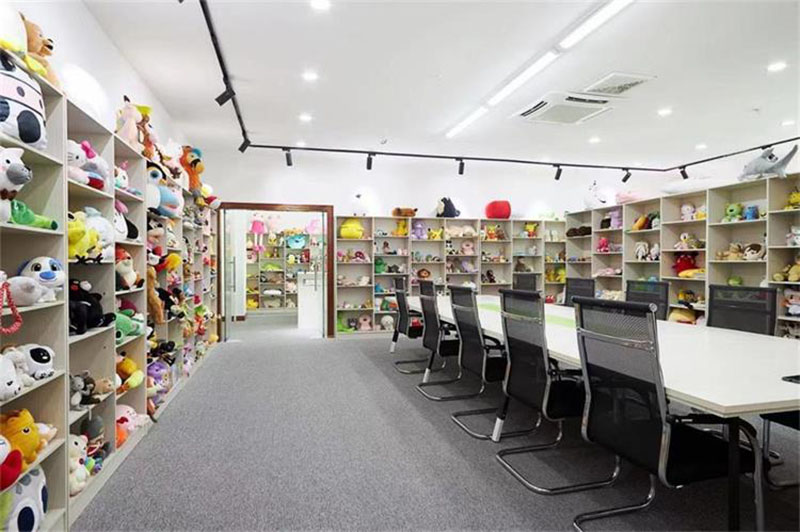
Cost-quality balance is not a one-time calculation made at the beginning of a product development cycle — it is an ongoing collaborative process between buyer and manufacturer that improves with each successive order as both parties develop deeper understanding of where cost is being generated and where quality is most valued by customers.
Buyers should work with their manufacturer to find the right cost-quality balance through structured collaborative reviews at three specific points in the product lifecycle: pre-design cost review before the brief is submitted, pre-production value engineering review during the sampling stage, and post-production cost analysis after each production run is completed.
Here is a framework for the three-point collaborative cost-quality review process:
Pre-Design Cost Review
| Review Element | What Is Discussed | Output | Timing |
|---|---|---|---|
| Design feasibility and cost analysis | Factory reviews concept for complexity and cost drivers | Cost optimization opportunities identified | Before brief submission |
| Material direction discussion | Buyer’s quality requirements versus available material grades | Optimized material specification | Before brief submission |
| Packaging direction | Packaging options aligned with product positioning | Cost-efficient packaging specification | Before brief submission |
| Volume discussion | Likely order volumes and their economic implications | Volume strategy recommendation | Before brief submission |
Pre-Production Value Engineering Review
| Review Element | What Is Discussed | Output | Timing |
|---|---|---|---|
| First sample cost comparison | Compare sample cost to target cost | Cost gap identified | After first sample received |
| Design adjustments review | Specific changes that reduce cost without quality impact | Approved adjustments for revision | During revision stage |
| Material confirmation | Verify specified materials meet quality requirement at cost target | Confirmed material specification | Before counter sample |
| Construction optimization | Review construction sequence for efficiency | Optimized production specification | Before production authorization |
Post-Production Cost Analysis
| Review Element | What Is Discussed | Output | Timing |
|---|---|---|---|
| Defect cost review | Actual rework and rejection costs from production run | Root cause identification for future prevention | After production completion |
| QC efficiency review | Whether QC investment was proportionate to risk | Adjusted QC specification for next order | After production completion |
| Material performance review | Whether material choices achieved expected quality-cost outcome | Material specification refinements for reorder | After first sales data |
| Volume strategy review | Whether order volume was correct for demand | Adjusted volume strategy for next order | After initial sales period |
Building Cost-Quality Intelligence Over Time
The collaborative cost-quality review process becomes more valuable with each successive order — because each review generates information that improves the next order’s decisions. A post-production defect analysis that identifies the specific stitching operation that generated 60 percent of the rework cost directly informs the process specification for the next order. A post-sales material review that identifies customer feedback on specific quality dimensions directly informs the material specification refinement for the reorder.
Over time, this accumulating cost-quality intelligence produces a production specification that is optimized for the specific product, the specific market, and the specific quality expectations of the customers who buy it — achieving better cost efficiency at the same or higher quality level than the original specification, through the continuous improvement that only a stable, long-term manufacturing partnership can produce.
At Kinwin, cost-quality optimization is a standard component of how we work with our clients — not because we offer it as a premium service but because we understand that manufacturers who help their clients achieve better economics at the same quality level build the kind of long-term relationships that are valuable for both parties. Our pre-development cost reviews, design optimization recommendations, and post-production cost analyses are part of the manufacturing partnership we provide to every client.
If you are working on a plush product where cost is a significant constraint and you want to understand what genuine cost-quality optimization looks like in practice — what design changes create savings, what material alternatives maintain quality at lower cost, what production process improvements reduce total project cost — we would be glad to work through it with you.
Reach out to our team at [email protected] or visit kinwintoys.com to start that conversation.
Conclusion
Controlling plush toy costs without losing quality is not about finding the price that the factory will accept — it is about finding where cost is being generated unnecessarily and addressing it at the source. Design complexity that exceeds what the customer perceives. Material quality that exceeds what the application requires. Production processes that are less efficient than alternatives that produce the same result. Quality systems that catch problems expensively rather than preventing them cheaply. Packaging that costs more than the retail presentation requires.
Each of these is a genuine cost reduction opportunity that leaves quality unchanged — because the cost being eliminated was not delivering quality value in the first place. Finding these opportunities requires manufacturing knowledge that most buyers do not have independently — which is why the collaborative relationship with an experienced manufacturer is the practical mechanism through which cost-quality optimization is achieved.
Buyers who build this collaborative relationship, who share cost targets openly with their manufacturer, and who engage in structured cost-quality reviews at each stage of the product lifecycle consistently achieve better economics at the same or better quality level than those who approach cost management through price negotiation alone. The difference, compounded across multiple products and multiple orders, is the commercial advantage of sourcing intelligence over sourcing pressure.
FAQ
Q1: Is it ever appropriate to accept a lower-quality material to meet a cost target, and how should buyers evaluate this trade-off?
Lower-quality material substitution is appropriate when the quality reduction is not perceptible in the context of the product’s intended use and market positioning. The evaluation framework is customer perception — does the proposed material change create a quality difference that customers would notice, measure, or respond to? A pile height reduction from 20mm to 15mm on a mid-market product may be imperceptible to most customers. A filling density reduction that causes visible shape retention problems is not. The practical evaluation method is a blind comparison test during the sampling stage — producing the same product with both materials and evaluating whether trained evaluators, let alone typical customers, can distinguish the difference in the product’s intended display or use context. If the difference is not detectable in this test, the substitution achieves genuine cost reduction without quality compromise. If it is detectable, the substitution compromises quality and the cost saving is not genuine — it will be offset by the quality perception gap it creates.
Q2: How much of a unit price premium is typically justified to achieve meaningfully better quality control, and how should buyers quantify this?
The price premium justified by better quality control should be calculated against the defect cost reduction it produces rather than against a general quality perception. If a factory with strong quality control charges $0.50 more per unit than one with weak quality control, the question is whether the defect rate difference between the two factories generates more or less than $0.50 per unit in defect-related costs. At a 1,000-unit order, the $0.50 premium costs $500 total. If the weak-QC factory’s higher defect rate generates $2,000 in rework, inspection, and delay costs that the strong-QC factory’s defects do not, the premium is justified at more than 4× its cost. This calculation requires a realistic estimate of the defect rate difference — best obtained through reference checks with each factory’s existing clients — and a realistic estimate of the per-defect remediation cost for the specific product type. Buyers who have conducted this calculation even approximately consistently find that quality control premiums are economically justified at any commercially realistic defect rate differential.
Q3: What is the most common cost reduction mistake buyers make that ends up increasing total costs?
The most common cost reduction mistake is eliminating or reducing the counter sample stage to save sampling cost and timeline. The counter sample — which verifies that the production environment can replicate the approved development sample before any bulk production begins — prevents the most expensive single quality failure in plush manufacturing: sample-to-bulk inconsistency that requires full batch rework or replacement. The counter sample costs a sampling fee of $100 to $300 and adds one to two weeks to the development timeline. The sample-to-bulk failure it prevents costs $5,000 to $30,000 in rework, replacement production, expedited shipping, and timeline disruption. Buyers who eliminate the counter sample to save $200 and two weeks are accepting a small probability of a catastrophic cost event in exchange for a certain, minor saving — a risk-return trade-off that consistently produces net negative outcomes over any meaningful number of production cycles.
Q4: How should buyers approach cost reduction differently for promotional plush products compared to retail-quality branded products?
The cost reduction approach for promotional plush products can legitimately differ from retail-quality products because the performance requirements are genuinely different. Promotional plush typically has limited expected use, lower quality perception expectations, non-critical compliance requirements (depending on the market), and cost sensitivity that is more directly tied to the commercial context of the promotional program. In this context, material grade reductions, simplified construction, and reduced finishing standards that would be inappropriate for retail-quality products may be entirely appropriate — because the quality reduction is not below the threshold the customers will experience as inadequate for the intended application. The evaluation framework is the same — does the quality reduction create a customer-perceived quality gap? — but the threshold is different because the promotional context creates different customer expectations. The critical constraint is compliance — even promotional products distributed in regulated markets must meet the applicable safety standards regardless of their simplified construction or reduced material grade.
Q5: How does the cost-quality optimization framework change for reorders compared to new product development?
Reorders offer cost-quality optimization opportunities that are not available during new product development — because the production knowledge accumulated in the original project eliminates many of the fixed costs and learning-curve inefficiencies that contributed to the original unit cost. The most productive reorder cost review focuses on three areas. First, material performance review — reviewing first-order customer feedback to assess whether any material elements were above or below the quality threshold the market actually values, and adjusting specifications accordingly. Second, construction sequence optimization — using the production experience from the original run to identify any construction steps that were inefficient and proposing specific improvements for the reorder. Third, volume strategy review — using actual sales data from the first order to forecast demand more accurately and align reorder volume with a more confident demand estimate, potentially reaching a higher volume tier that improves unit economics without the inventory risk that a higher-volume first order would have carried under demand uncertainty.