Skip to content
 I’m Amanda from Kinwin in China. I help brands, retailers, and DTC teams build plush lines that feel soft, pass audits, and sell through. When people ask me “How big is the plushie market?”, they usually want more than a number. They want to know where growth really happens, which segments carry the margin, how licensing and influencers move units, and what supply-side costs limit scale. In this guide, I explain the global size and structure of the plushie market in clear, practical language, then map demand drivers, risks, and forecasting methods your team can use this quarter.
What is the current global market size for plushies, and how is it segmented by region and channel?
Recent third-party estimates put the global stuffed/plush toys market in the $11–13.7B range today, depending on the methodology and scope. For example, Grand View Research sizes the market at $11.76B in 2023 with a projected 8.2% CAGR to 2030; Mordor Intelligence places 2025 at $13.75B with an 8.3% CAGR to 2030; GMI Insights reports $11.3B in 2024 with 5%+ CAGR. Differences come from what each firm includes (keychains, pillows, accessories) and whether “soft toys” are counted separately. For context, the overall global toy market sits around $112B in 2024, so plush is a meaningful, steady subcategory. techsciresearch.com+3grandviewresearch.com+3Mordor Intelligence+3
Regionally, the U.S. accounts for roughly $3.4B in 2023 and is trending toward $5.1B by 2030 at a 6.1% CAGR. E-commerce and specialty retail share continue to climb, while mass retail drives predictable volume. In Europe, premium brands and licensing drive higher AOV; in APAC, character IP and blind-box ecosystems deliver velocity. Channel mix is shifting: online marketplaces and DTC handle launches and limited drops; brick-and-mortar sustains core animals and seasonal gifting. grandviewresearch.com+1
Table 1 — Market Size & Structure (directional)
| Scope | Recent estimate | Trajectory | Notes |
|---|---|---|---|
| Global plush/stuffed | $11–13.7B | ~5–8% CAGR to 2030 | Methodology varies (soft toys included or not) grandviewresearch.com+2Mordor Intelligence+2 |
| U.S. plush/stuffed | $3.4B (2023) | 6.1% CAGR to 2030 | To ~$5.1B by 2030 grandviewresearch.com+1 |
| Total toy market | $111.8B (2024) | ~4.8% CAGR | Plush is a steady sub-category techsciresearch.com |
| Key growth engines | DTC, marketplaces, specialty | Rising mix | Limited drops + fast content cycles |
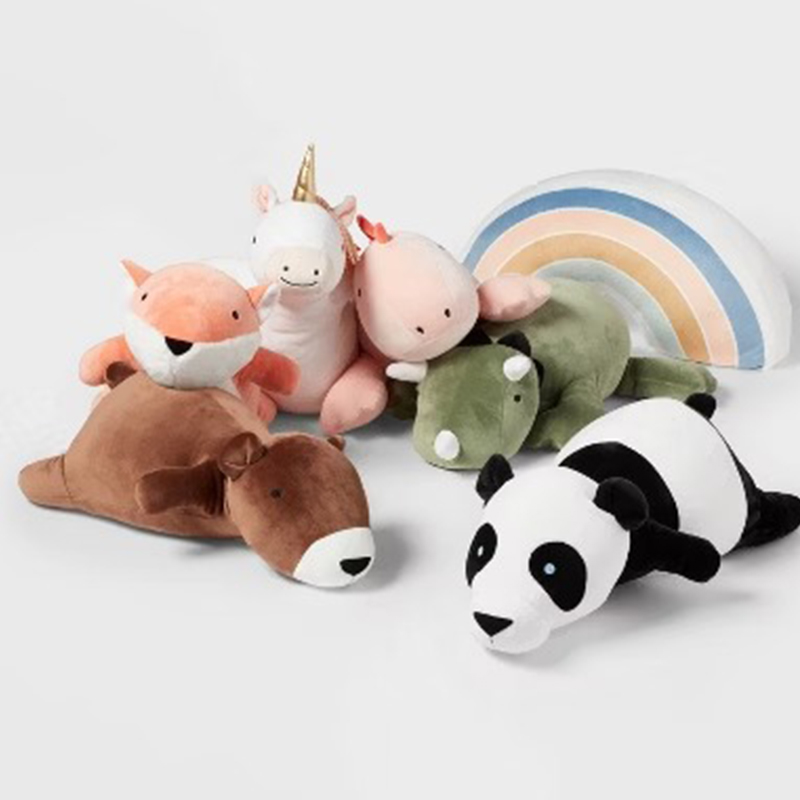
Which consumer segments (kids, collectors, décor, wellness) and price tiers drive the highest volume and margin?
In volume, kids’ core animals dominate: short-pile faces, simple silhouettes, and giftable price points. In margin, adult collectors and décor buyers pull ahead with limited runs, gift-ready packaging, and edition tags. Wellness/weighted plush adds perceived value when double-pouched pellets and clear care labeling are used; age grading and documented testing are essential for retailer acceptance.
A practical pricing ladder looks like this: entry ($8–$15) for minis and clip-ons; core ($15–$30) for standard animals; premium ($30–$60+) for licensed, faux-fur, weighted, or boxed SKUs; collectible/limited ($60–$120+) for editions and collabs. The fastest payback happens when a line combines a baseline core SKU (predictable reorders) with a capsule (urgency and AOV lift).
Table 2 — Segment & Price-Tier Map (where volume vs. margin lives)
| Segment | Typical price | Volume driver | Margin driver |
|---|---|---|---|
| Kids’ core animals | $15–$30 | Year-round gifting, evergreen SKUs | Clean face, soft handfeel |
| Minis/keychains | $8–$15 | Impulse buys, bundles | Display trays, blind elements |
| Décor plush | $25–$60 | Seasonal home refresh | Sit-stable base, palettes |
| Weighted/wellness | $30–$60+ | Comfort story | Double-pouched pellets, care clarity |
| Collectors/limited | $60–$120+ | Scarcity & fandom | Edition tags, gift boxes |
How do licensing ecosystems, influencer culture, and retail/marketplace dynamics shape demand and velocity?
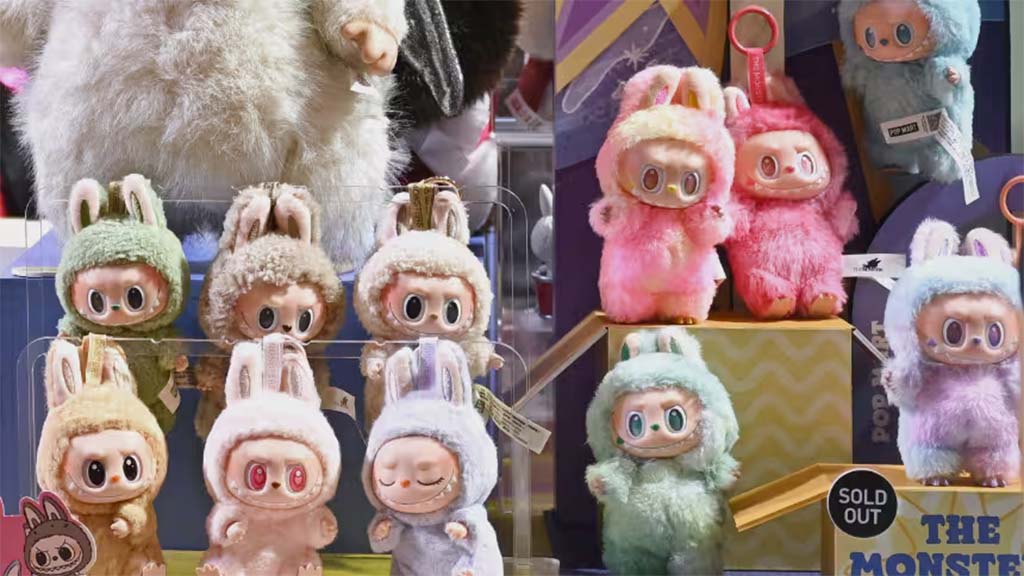
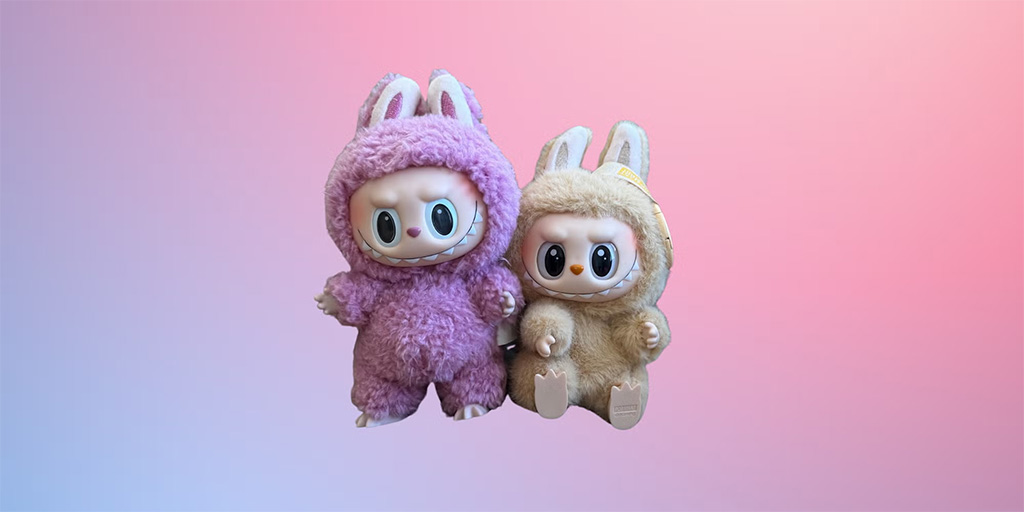
Licensing remains a power-law driver: big film/TV/game IP spikes demand, improves price realization, and compresses the decision window. The rise of blind-box/character ecosystems (e.g., Pop Mart’s Labubu) shows how scarcity, UGC, and retail theater can convert casual browsers into collectors at scale, with new plush variants (mini and long-fur editions) keeping velocity high. Meanwhile, brands like Jellycat illustrate how distinctive design and social virality can create sustained demand—and even a resale economy—well beyond classic kids’ channels. AP News+2WIRED+2
On platforms, marketplaces turn launches into measurable tests (sell-through in 48 hours), while specialty retail anchors full-price sell-through with curated displays. DTC lets you run preorders, waitlists, and staggered drops; it also requires strong PDP truth (macro textures, scale-in-hand photos, short squeeze clips) to control returns—the silent margin killer.
Table 3 — Demand Flywheels
| Flywheel | What powers it | Why it sustains |
|---|---|---|
| Licensing + drops | Canon IP, collabs, timed waves | Built-in audience + urgency |
| Influencers + UGC | Unboxings, room tours, cosplay | Social proof → repeat buys |
| Retail theater | Endcaps, blind displays, gift boxes | Impulse + higher AOV |
| DTC loops | Waitlists, preorders, limited runs | Forecastable demand + data capture |
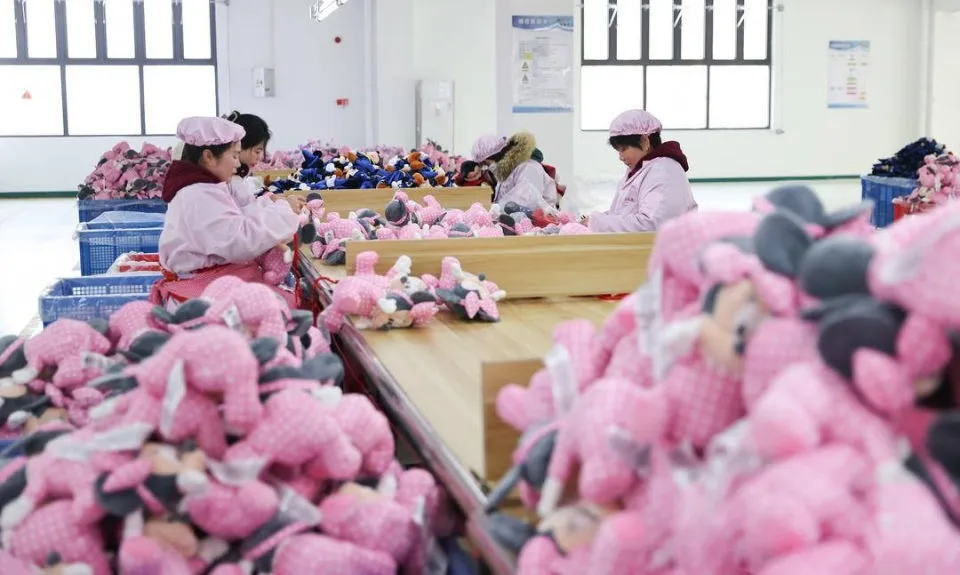
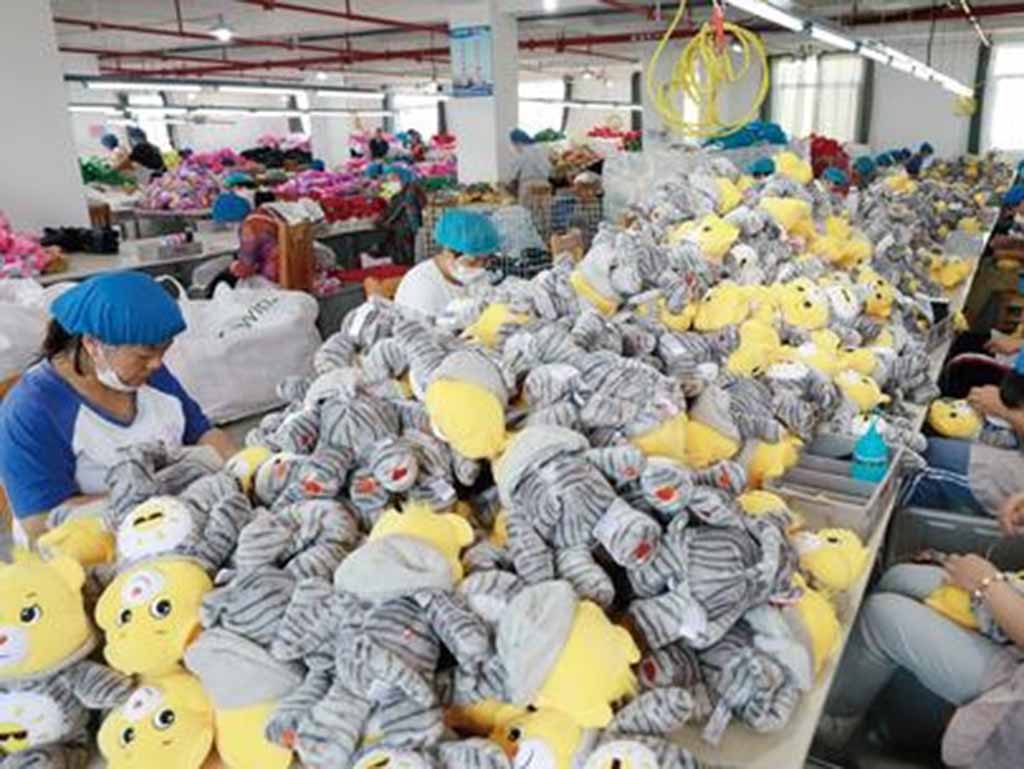
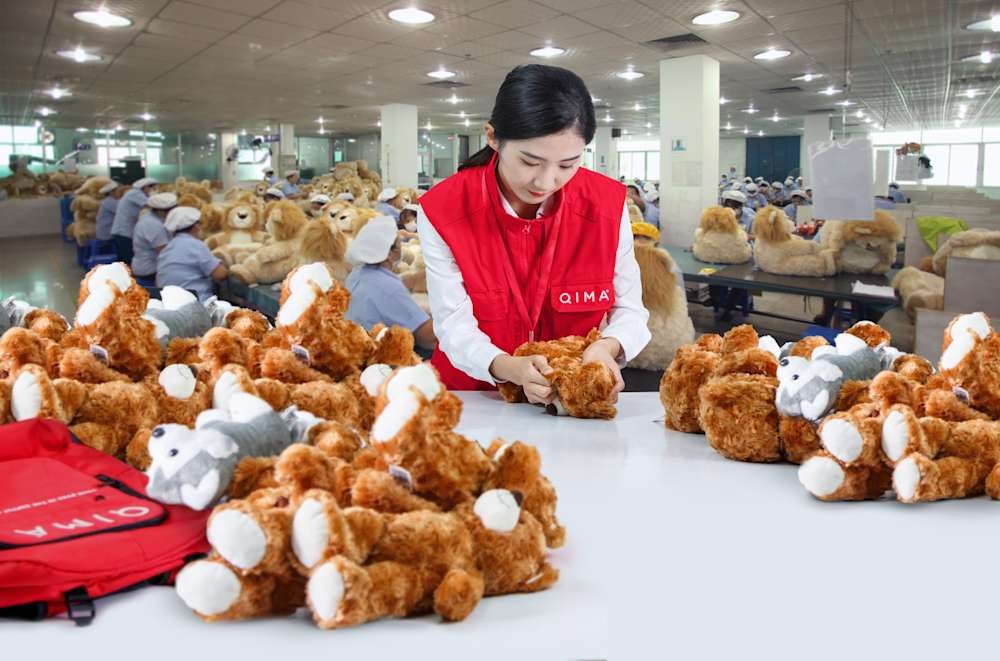
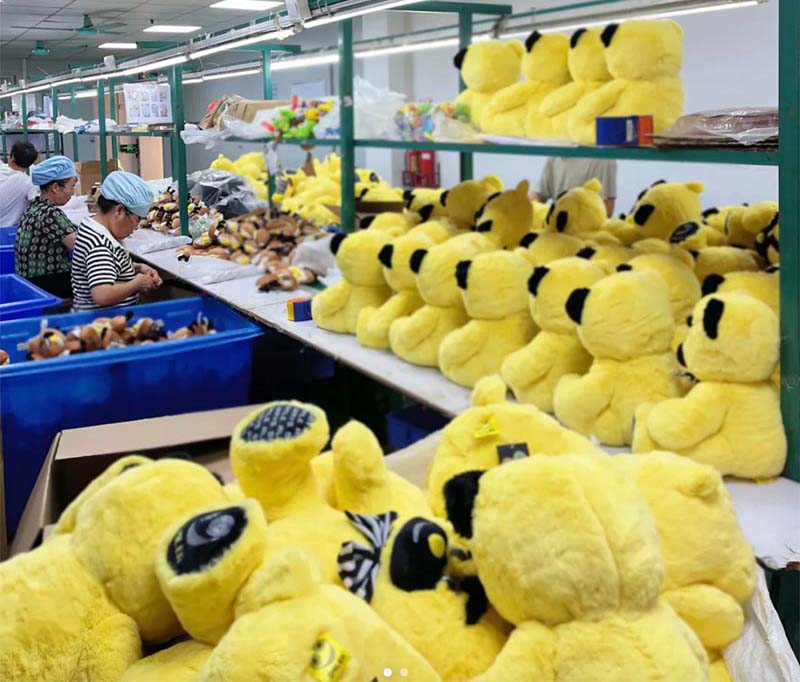
What supply-side factors—fabric costs, compliance overhead, and logistics—constrain growth or expand capacity?
On the supply side, three levers set your true cost and your ability to scale: materials, minutes, and compliance/logistics. Shell fabrics (minky/velboa/faux fur) and their dye lots drive both handfeel and yield; faux fur adds minutes and grooming but can lift AOV. Fill choice and panel-gram fill maps control consistency and reduce over-stuffing. Compliance (EN71/ASTM/CPSIA) is a must-have: tying tests to production lots protects shipments; ignoring it risks rework and holds. Freight is largely volumetric—cartonization and gentle compression (short-pile only) move the landed-cost needle most. In 2025, toy sales rebounded globally, but freight and capacity still swing with seasonality; plan buffers around peak months and holidays. circana.com
Table 4 — Supply Levers & Capacity Impact
| Lever | Cost/Capacity effect | Practical move |
|---|---|---|
| Fabric system | Pile height & GSM set minutes | Short-pile faces; trim masks on faux fur |
| Fill strategy | Over-stuffing inflates COGS | Fill grams per panel; baffles for big bodies |
| Compliance | Lot-tied tests add time & cost | Plan early; avoid re-tests by locking BOM |
| Freight | Plush cubes out before weighs out | Right-size cartons; trial safe compression |
| Seasonality | Factory load + port congestion | Reserve capacity; pilot earlier drops |
How resilient is plush demand across seasons and macro cycles, and what indicators predict downturns or spikes?
Plush is surprisingly resilient because it serves multiple jobs: gifting, comfort, décor, and fandom. The category benefits from Q4 holidays, Valentine’s, Mother’s Day/Graduation, and convention seasons, yet it also sells all year via décor and collectors. During macro slowdowns, value shifts from higher-priced licensed SKUs toward core animals and minis; during rebounds, limited editions, collabs, and licensed spikes return. Recent industry data showed a global toy rebound in H1-2025 (+7% YoY), a reminder that aggregated toy cycles can lift plush demand along with them. circana.com
Early indicators I trust: 48-hour velocity after launch, waitlist growth, creator demand for samples, and retailer endcap availability. Negative signals include rising return rates due to handfeel mismatch (often a fill-map/spec issue), slowing add-to-cart on hero SKUs, and softening wholesale reorders.
Table 5 — Resilience Signals (watch these weekly)
| Indicator | Read as | Why it matters |
|---|---|---|
| 48-hour sell-through | Health of launch | Predicts reorders, cash needs |
| Waitlist growth | Future demand | Guides MOQ and ocean vs. air |
| Return reasons | Spec truth or mismatch | Fix fill grams, SPI, care copy |
| Reorder cadence | Retailer confidence | Capacity planning |
| Creator/UGC volume | Social momentum | Select SKUs for capsule drops |
Which forecasting methods and data sources (sell-through, preorder waitlists, panel data) best estimate the next 3–5 years?
For next-3–5-year planning, I blend bottom-up sell-through with top-down market baselines. Start with your own weekly unit data by size, fabric, and price, then overlay seasonal calendars and major IP releases. Add waitlists/preorders for new SKUs—these convert intention into an adjustable demand curve. Use panel data/industry reports for guardrails: today’s published forecasts cluster around ~5–8% CAGR for global plush/stuffed toys to 2030. Stitch this into three scenarios—base, upside (licensed wins + viral UGC), and downside (freight spikes + retail constraints). grandviewresearch.com+2Mordor Intelligence+2
Operationally, I run pilot drops (small lots) and read 48-hour velocity. If a SKU sells 30–40% in the first week and returns stay low, convert to ocean replenishment with right-sized cartons. If velocity is modest, pivot to minis or accessories to protect cash. For category benchmarking, I also monitor overall toy growth as a macro fence (if global toys accelerate or slow, plush usually follows with a lag). techsciresearch.com
Table 6 — Forecasting Toolkit (3–5 years)
| Tool | What it gives you | How to use it |
|---|---|---|
| Sell-through by variant | True pull by size/fabric/price | Weekly cohorts; spot cannibalization |
| Waitlists / preorders | Early demand read | Gate MOQs; set air vs. ocean |
| 48-hour velocity | Launch health | Trigger reorders or pause |
| Panel/analyst CAGR | Market guardrails | Stress-test your base case (5–8% CAGR) grandviewresearch.com+1 |
| Macro toy data | Cycle direction | Adjust inventory risk circana.com+1 |
Conclusion
The plushie market today is a healthy $11–13B global category, growing roughly 5–8% per year, with dependable volume in kids’ core animals and outsized margin in collectors, décor, and wellness. Velocity is shaped by licensing, UGC, and retail theater, while capacity and cost depend on materials, minutes, compliance, and freight. If you build with numeric specs, read your 48-hour signals, and plan inventory in phased drops, you can grow share and protect margin—even in choppy cycles. Need help turning briefs into retail-ready plush with clean compliance files? Email [email protected] or visit kinwintoys.com—my team at Kinwin can support you from PPS to on-time mass.